
Human Resource Analytics: Enhancing Organizational Effectiveness through HR Analytics
This HR Analytics project is designed to provide a holistic understanding of the organization by focusing on key areas.
Objectives
Objectives include analyzing current demographics and management structures, evaluating organizational performance, assessing employee satisfaction levels, and identifying and addressing counterproductive work behaviors. Through a combination of quantitative and qualitative methods, the project aims to deliver actionable insights to enhance overall organizational effectiveness and employee well-being.
- Determine the current demographic and management structure of the organisation
- Determine the level of organization performance
- Determine the level of organization satisfaction
- Determine the level of organization counterproductive work behaviour
Part One: Understanding the Background and Data
Content
The CSV revolves around a fictitious company and the core data set contains names, DOBs, age, gender, marital status, date of hire, reasons for termination, department, whether they are active or terminated, position title, pay rate, manager name, and performance score.
Recent additions to the data include:
Absences
Most Recent Performance Review Date
Employee Engagement Score
Acknowledgements
Dr. Carla Patalano provided the baseline idea for creating this synthetic data set, which has been used now by over 200 Human Resource Management students at the college. Students in the course learn data visualization techniques with Tableau Desktop and use this data set to complete a series of assignments.
import numpy as np
import pandas as pd
import matplotlib.pyplot as plt
import seaborn as sns
df = pd.read_csv("/kaggle/input/human-resources-data-set/HRDataset_v14.csv")
Information about the data and table example
df.info()
<class 'pandas.core.frame.DataFrame'>
RangeIndex: 311 entries, 0 to 310
Data columns (total 36 columns):
 #   Column                      Non-Null Count  Dtype
---  ------                      --------------  -----
 0   Employee_Name               311 non-null    object
 1   EmpID                       311 non-null    int64
 2   MarriedID                   311 non-null    int64
 3   MaritalStatusID             311 non-null    int64
 4   GenderID                    311 non-null    int64
 5   EmpStatusID                 311 non-null    int64
 6   DeptID                      311 non-null    int64
 7   PerfScoreID                 311 non-null    int64
 8   FromDiversityJobFairID      311 non-null    int64
 9   Salary                      311 non-null    int64
 10  Termd                       311 non-null    int64
 11  PositionID                  311 non-null    int64
 12  Position                    311 non-null    object
 13  State                       311 non-null    object
 14  Zip                         311 non-null    int64
 15  DOB                         311 non-null    object
 16  Sex                         311 non-null    object
 17  MaritalDesc                 311 non-null    object
 18  CitizenDesc                 311 non-null    object
 19  HispanicLatino              311 non-null    object
 20  RaceDesc                    311 non-null    object
 21  DateofHire                  311 non-null    object
 22  DateofTermination           104 non-null    object
 23  TermReason                  311 non-null    object
 24  EmploymentStatus            311 non-null    object
 25  Department                  311 non-null    object
 26  ManagerName                 311 non-null    object
 27  ManagerID                   303 non-null    float64
 28  RecruitmentSource           311 non-null    object
 29  PerformanceScore            311 non-null    object
 30  EngagementSurvey            311 non-null    float64
 31  EmpSatisfaction             311 non-null    int64
 32  SpecialProjectsCount        311 non-null    int64
 33  LastPerformanceReview_Date  311 non-null    object
 34  DaysLateLast30              311 non-null    int64
 35  Absences                    311 non-null    int64
dtypes: float64(2), int64(16), object(18)
memory usage: 87.6+ KB
df.head()
| Employee_Name | EmpID | MarriedID | MaritalStatusID | GenderID | EmpStatusID | DeptID | PerfScoreID | FromDiversityJobFairID | Salary | ... | ManagerName | ManagerID | RecruitmentSource | PerformanceScore | EngagementSurvey | EmpSatisfaction | SpecialProjectsCount | LastPerformanceReview_Date | DaysLateLast30 | Absences | |
|---|---|---|---|---|---|---|---|---|---|---|---|---|---|---|---|---|---|---|---|---|---|
| 0 | Adinolfi, Wilson K | 10026 | 0 | 0 | 1 | 1 | 5 | 4 | 0 | 62506 | ... | Michael Albert | 22.0 | Exceeds | 4.60 | 5 | 0 | 1/17/2019 | 0 | 1 | |
| 1 | Ait Sidi, Karthikeyan | 10084 | 1 | 1 | 1 | 5 | 3 | 3 | 0 | 104437 | ... | Simon Roup | 4.0 | Indeed | Fully Meets | 4.96 | 3 | 6 | 2/24/2016 | 0 | 17 |
| 2 | Akinkuolie, Sarah | 10196 | 1 | 1 | 0 | 5 | 5 | 3 | 0 | 64955 | ... | Kissy Sullivan | 20.0 | Fully Meets | 3.02 | 3 | 0 | 5/15/2012 | 0 | 3 | |
| 3 | Alagbe,Trina | 10088 | 1 | 1 | 0 | 1 | 5 | 3 | 0 | 64991 | ... | Elijiah Gray | 16.0 | Indeed | Fully Meets | 4.84 | 5 | 0 | 1/3/2019 | 0 | 15 |
| 4 | Anderson, Carol | 10069 | 0 | 2 | 0 | 5 | 5 | 3 | 0 | 50825 | ... | Webster Butler | 39.0 | Google Search | Fully Meets | 5.00 | 4 | 0 | 2/1/2016 | 0 | 2 |
5 rows × 36 columns
Part Two: Exploratory Data Analysis
Demographics
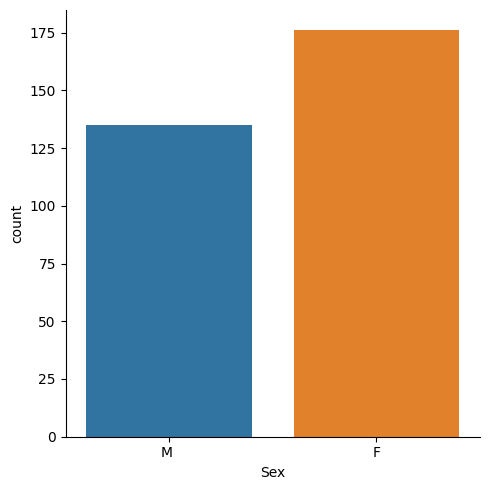
Sex distribution in the organisation
sns.catplot(x='Sex',kind='count',data=df)
<seaborn.axisgrid.FacetGrid at 0x7b6614918970>
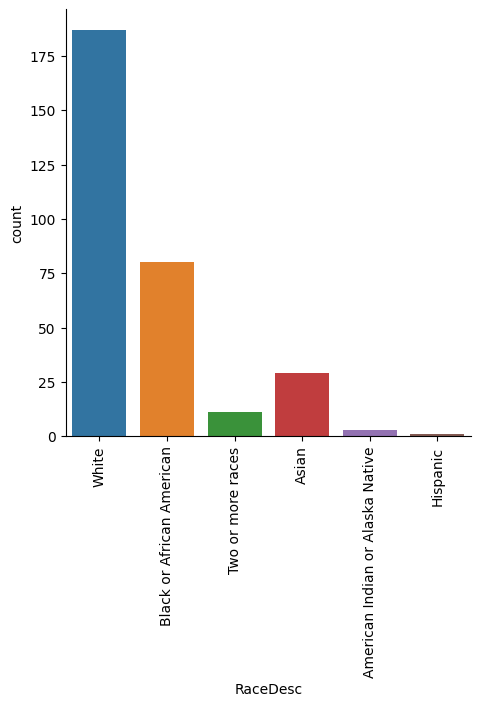
Ethnicity distribution in the organisation
plt.figure(figsize=(14,10), dpi=200)
sns.catplot(x='RaceDesc',kind='count', data=df)
plt.xticks(rotation=90)
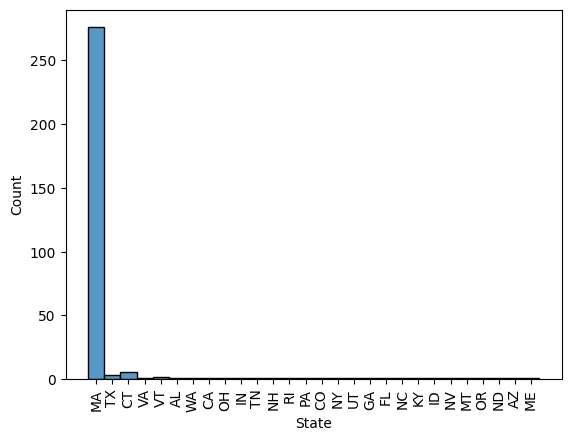
Location-Based Distribution
sns.histplot(data=df, x="State")
plt.xticks(rotation=90)
Organisation structure
Position Distribution Overview
pd.DataFrame(df["Position"].value_counts())
| count | |
|---|---|
| Position | |
| Production Technician I | 137 |
| Production Technician II | 57 |
| Area Sales Manager | 27 |
| Production Manager | 14 |
| Software Engineer | 10 |
| IT Support | 8 |
| Data Analyst | 7 |
| Sr. Network Engineer | 5 |
| Database Administrator | 5 |
| Network Engineer | 5 |
| BI Developer | 4 |
| Senior BI Developer | 3 |
| Administrative Assistant | 3 |
| Sales Manager | 3 |
| Accountant I | 3 |
| Sr. DBA | 2 |
| IT Manager - DB | 2 |
| Sr. Accountant | 2 |
| Director of Operations | 1 |
| Shared Services Manager | 1 |
| Data Analyst | 1 |
| Data Architect | 1 |
| Principal Data Architect | 1 |
| IT Manager - Infra | 1 |
| President & CEO | 1 |
| Enterprise Architect | 1 |
| BI Director | 1 |
| Director of Sales | 1 |
| IT Director | 1 |
| IT Manager - Support | 1 |
| Software Engineering Manager | 1 |
| CIO | 1 |
How many managers organization have? How many subordinates does a manager have?
managersN = len(df["ManagerID"].unique())
employee_counts = df['ManagerID'].value_counts()
print(f"There is {managersN} managers in total. Every manager have to manage {round(employee_counts.mean(), 2)} employees in average.")
There is 24 managers in total. Every manager have to manage 13.17 employees in average.
How many managers are per department?
managers_per_department = df.groupby('Department')['ManagerID'].nunique()
managers_per_department
Department
Admin Offices            4
Executive Office         1
IT/IS                    6
Production              11
Sales                    4
Software Engineering     3
Name: ManagerID, dtype: int64
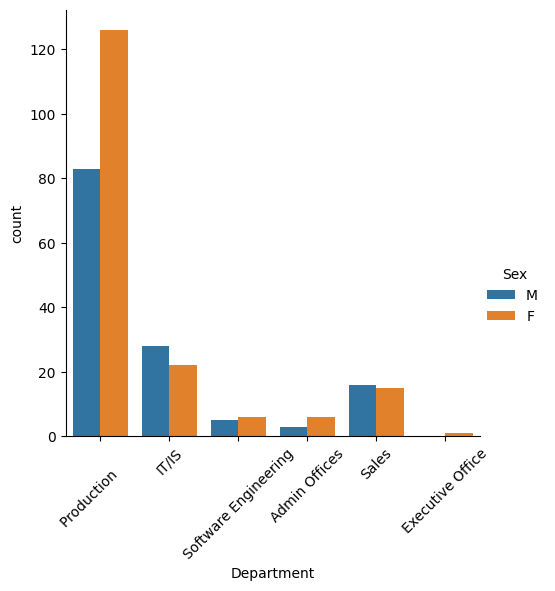
What is employees distribution across departments?
sns.catplot(x= 'Department',kind='count',data=df, hue="Sex")
plt.xticks(rotation=45)
Organisation Performance
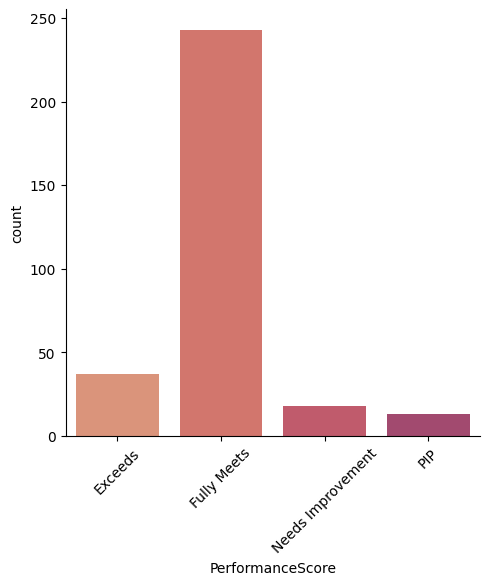
What is the distribution of Performance Score in the organization?
color_palette = sns.color_palette("flare")
sns.set_palette(color_palette)
sns.catplot(x = "PerformanceScore",kind='count', data = df)
plt.xticks(rotation=45)
sns.catplot(x= 'PerformanceScore',kind='count',data=df, hue="Department")
plt.xticks(rotation=45)
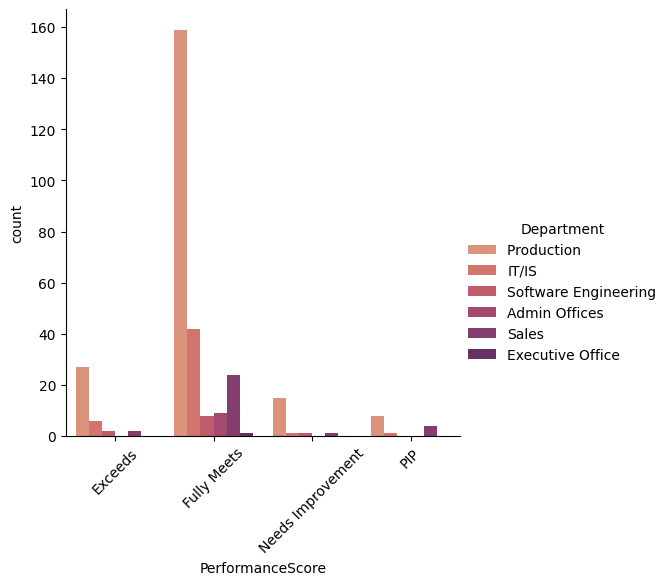
Due to absolute count and unequal distributions of employees per depertment, performance score among departments can’t be compared. Therefore, relative proportion, taking into account the relative number of employee per depertment, is calculated for better comparison.
# Calculate the percentage of each category within each department
percentages = df.groupby(['Department', 'PerformanceScore']).size().div(df.groupby('Department').size()).mul(100).reset_index(name='Percentage')
# Create a pivot table for better organization
pivot_table = pd.pivot_table(percentages, values='Percentage', index='PerformanceScore', columns='Department')
pivot_table
| Department | Admin Offices | Executive Office | IT/IS | Production | Sales | Software Engineering |
|---|---|---|---|---|---|---|
| PerformanceScore | ||||||
| Exceeds | NaN | NaN | 12.0 | 12.918660 | 6.451613 | 18.181818 |
| Fully Meets | 100.0 | 100.0 | 84.0 | 76.076555 | 77.419355 | 72.727273 |
| Needs Improvement | NaN | NaN | 2.0 | 7.177033 | 3.225806 | 9.090909 |
| PIP | NaN | NaN | 2.0 | 3.827751 | 12.903226 | NaN |
How many special projects does each department have?
sns.catplot(x= 'SpecialProjectsCount',kind='count',data=df[(df["SpecialProjectsCount"]> 0)] , hue="Department")
plt.xticks(rotation=45)
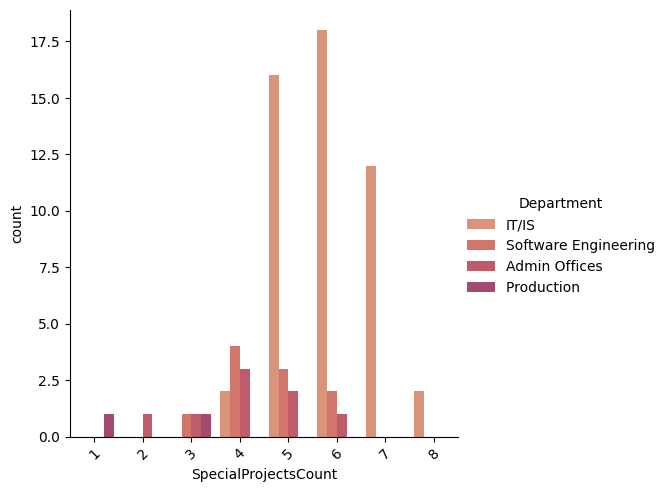
Interpretation The data shows that the Sales Department has the highest relative proportion for more improvement (Needs Improvement and PIP). In general, the organisation seems to have a good performance review. Also, the interesting highlight is that Sales does not have any Special projects, and the Production Department has only a couple of them. This highlight might indicate the origin of a lack of satisfying evaluation due to motivation levels. This relationship should be further explored.
Organisation Satisfaction
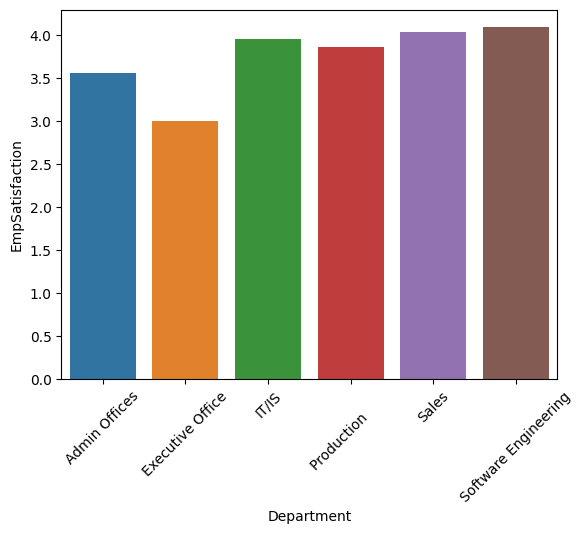
What is employees satisfaction and salary across departments?
dep_sat = df.groupby('Department')['EmpSatisfaction'].mean().reset_index()
sns.barplot(x='Department',y='EmpSatisfaction',data=dep_sat)
plt.xticks(rotation=45)
dep_sal = df.groupby('Department')['Salary'].mean().reset_index()
sns.barplot(x='Department',y='Salary',data=dep_sal)
plt.xticks(rotation=45)
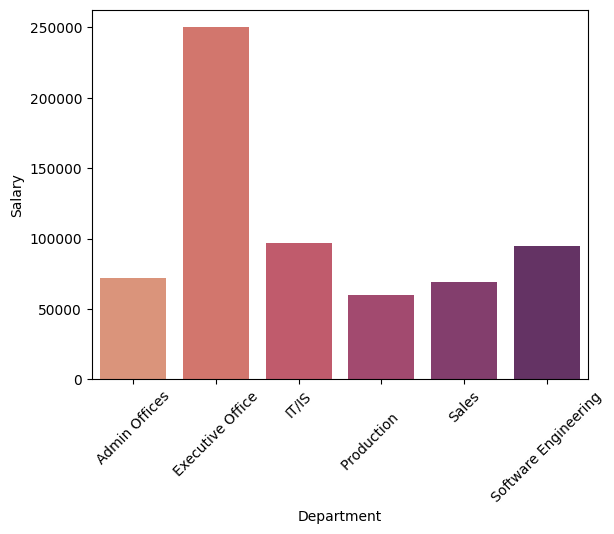
Interpretation It seems that there is no huge differences in employee satisfaction among departments. Although, Executive Office shows significant drop in satisfaction, in spite of the highest level of salary. Such insight indicates that origin of lower level of satisfaction in Executive Office can be attributed to other factors (for example, higher level of stress, etc.).
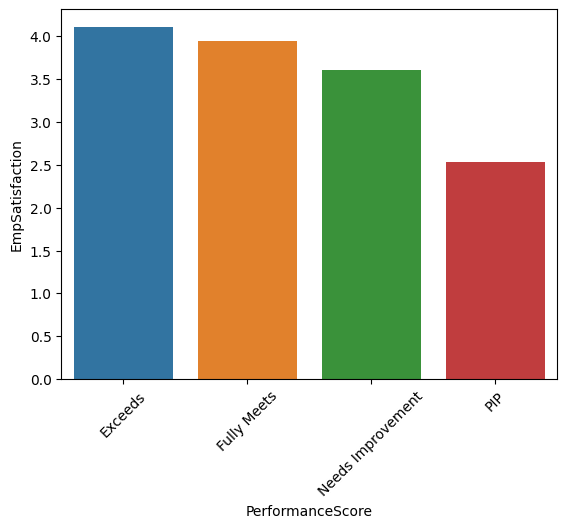
What is the level of employee satisfaction in respect to their performance score and salary?
per_sat = df.groupby('PerformanceScore')['EmpSatisfaction'].mean().reset_index()
sns.barplot(x='PerformanceScore',y='EmpSatisfaction',data=per_sat)
plt.xticks(rotation=45)
dep_sal = df.groupby('PerformanceScore')['Salary'].mean().reset_index()
sns.barplot(x='PerformanceScore',y='Salary',data=dep_sal)
plt.xticks(rotation=45)
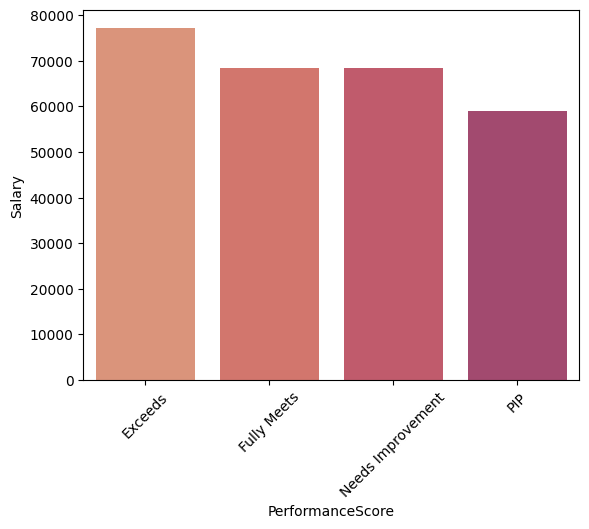
Interpretation Evidently, the employees that had lowest performance score also had lowest satisfaction and salary. Such a finding requires a deeper analysis, to seek the casual relation - is low satisfaction and salary causes low performance score or vice versa.
Counterproductive work behavior
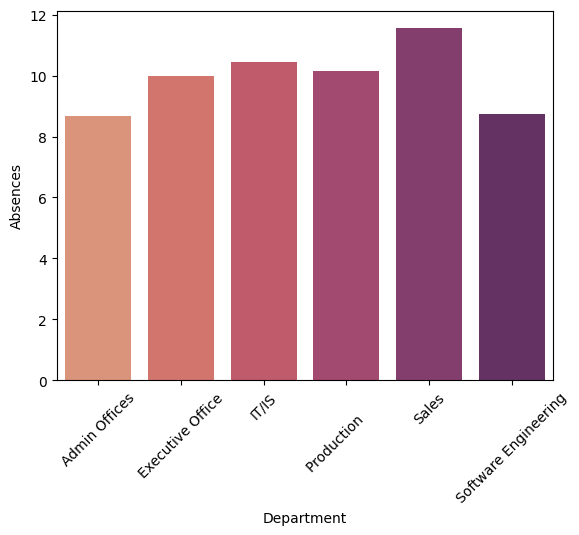
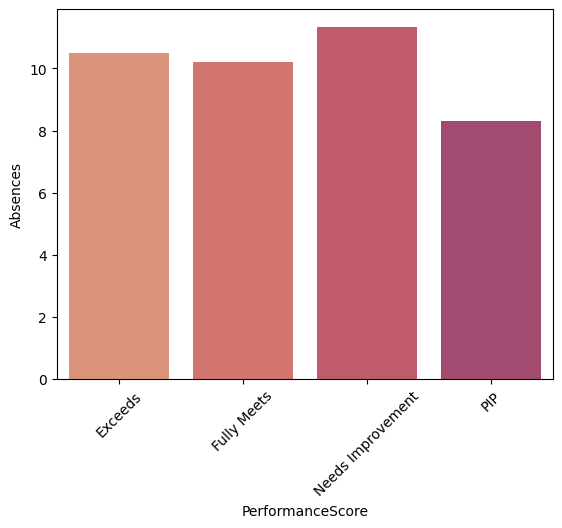
What is the degree of absenteeism across departments and performance score level?
dep_sal = df.groupby('Department')['Absences'].mean().reset_index()
sns.barplot(x='Department',y='Absences',data=dep_sal)
plt.xticks(rotation=45)
dep_sal = df.groupby('PerformanceScore')['Absences'].mean().reset_index()
sns.barplot(x='PerformanceScore',y='Absences',data=dep_sal)
plt.xticks(rotation=45)
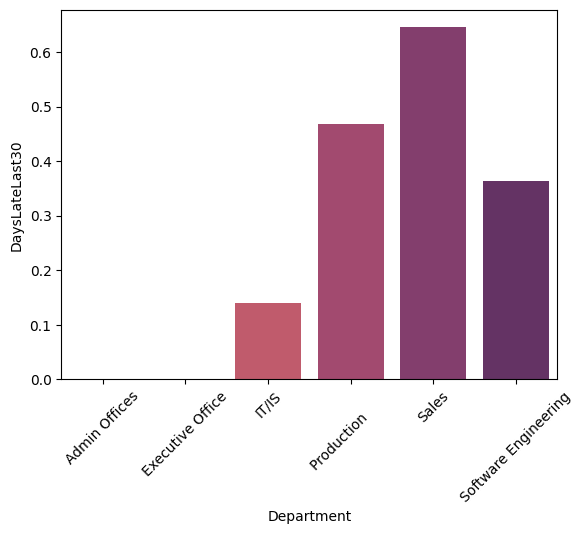
What is the degree of tardiness across departments and performance score level?
dep_sal = df.groupby('Department')['DaysLateLast30'].mean().reset_index()
sns.barplot(x='Department',y='DaysLateLast30',data=dep_sal)
plt.xticks(rotation=45)
dep_sal = df.groupby('PerformanceScore')['DaysLateLast30'].mean().reset_index()
sns.barplot(x='PerformanceScore',y='DaysLateLast30',data=dep_sal)
plt.xticks(rotation=45)
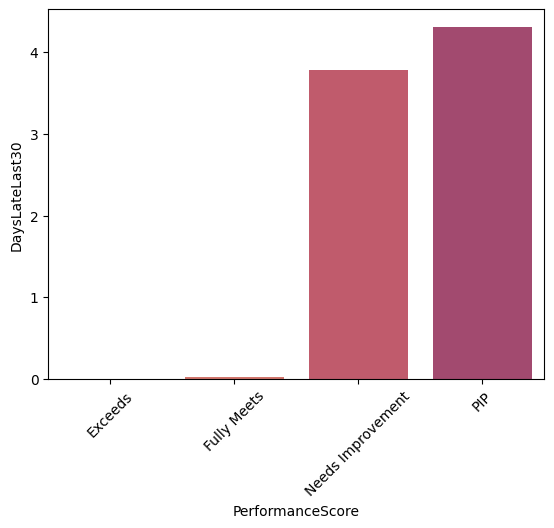
Interpretation Data show that Sales and Production Departments have highest level of counterproductive working behaviour, as well group that have lowest performance score (both departments are highly represented in those groups).
Conclusion
The analysis of organizational data reveals key insights. The Sales Department shows a notable need for improvement, suggesting potential areas for management attention and motivation enhancement. Conversely, the Executive Office experiences a significant drop in satisfaction despite having the highest salary, indicating the influence of non-monetary factors on job satisfaction. The correlation between low performance scores, lower satisfaction, and salary levels prompts further investigation into causal relationships. Additionally, Sales and Production Departments exhibit higher levels of counterproductive behavior, particularly in groups with lower performance scores, emphasizing the need for targeted strategies to mitigate such behaviors. Overall, these findings provide a foundation for focused interventions to improve organizational performance, employee satisfaction, and well-being.